Dynamometer and Data Acquisition System
for a Small Gas Turbine Engine
Captures 21 Channels of Engine Data at Programmable Intervals
NOTE: All our Products, Designs, and Services are SUSTAINABLE, ORGANIC, GLUTEN-FREE, CONTAIN NO GMO's, and will not upset anyone's precious FEELINGS or delicate SENSIBILITIES
INTRODUCTION
Any coherent engine development program requires the use of a system which can measure, record and chart the significant engine parameters which characterize engine performance. The system described here was built specifically to provide that measurement and capture capability to support the development of a small turboshaft engine (up to 200 HP). This dyno system was delivered to the client, who installed their engine and ran several full-power tests, only to discover that instead of the imagined-but-undocumented 200 HP, the engine barely produced 75 HP. The company is now off on another "state-of-the-art" engine project that is claiming even more power.
This dyno system consists of two major elements: (a) the Engine Mount mechanism ("Mount") which holds the engine in place and provides a mechanism to measure the instantaneous torque the engine is producing, and (b) the Data Acquisition system ("DAQ") which captures, displays and records the instantaneous torque being produced, the gas generator and power turbine speeds, and various other engine performance parameters (flows, pressures, temperatures).
This system was designed to be operated from a trailer-mounted engine stand pylon and controlled from within the protected confines of the trailer tow vehicle. In order to accomplish that flexibility, the DAQ instrumentation (sensors, cabling, etc.) attach to the engine stand on the trailer, and the DAQ computer, which can sit comfortably on the operator's lap, connects to the instrumentation through a single flexible cable which is 50 feet long. The entire system is powered from a plug and switch which inserts into the tow vehicle's cigar lighter outlet. There are pictures and more details on these components in the following material.
ENGINE MOUNT STRUCTURE
The Engine Mount Structure consists of a steel framework (the base) which is rigidly bolted to the top of a pylon on the engine test trailer, and another steel framework (the mount) to which the engine is rigidly attached. The mount is attached to the base by means of a low-friction hinge system on one side, and is supported on the free side by an "S"-beam load cell capable of measuring 500 Kg of either tension or compression.
In this system, the bottom of the load cell is fixed to the base plate. The load arm from the pivoting engine mount interfaces tangentially with a spherical contact point on the top of load cell.
The drawings at the bottom of this page define the locations of the mounting bolt holes in the Base for attachment to the pylon.
IT SHOULD BE NOTED that the front flange of the mount is drilled to match up with the mounting bolts on the existing engine gearbox. HOWEVER, the bolt holes which mate with the SIDE BOLTS on the engine must be drilled to match the engine itself. (More on that in the INSTALLATION section.)
The power absorber for this Dyno is a controllable pitch aircraft propeller attached to the engine gearbox output shaft. The engine generates torque to turn the propeller, and that torque is resisted by the load cell. Engine power is determined (as in all dynamometer systems) by measuring the instantaneous output torque and the instantaneous speed of the output shaft, then calculating instantaneous measured power by the equation HP = Torque x RPM / 5252, (as explained further HERE ).
NOTE: A LARGER VIEW OF ALMOST EVERY PICTURE HERE IS AVAILABLE
BY CLICKING ON THE DISPLAYED PICTURE.
Use your "BACK" button to return to this page after viewing
the larger version of any picture.
Figures 1 and 2 below show the Engine Mount component of the system (without the engine or propeller attached). Figure 2 shows the S-beam Load Cell location. The Tiedown Bolt is for the purpose of locking the hinged engine mount in place and preloading it against the load cell, to prevent vibratory and impact damage to the load cell during transport of the dyno. The Connector plugs into a mating socket on the amplifier box (discussed later).
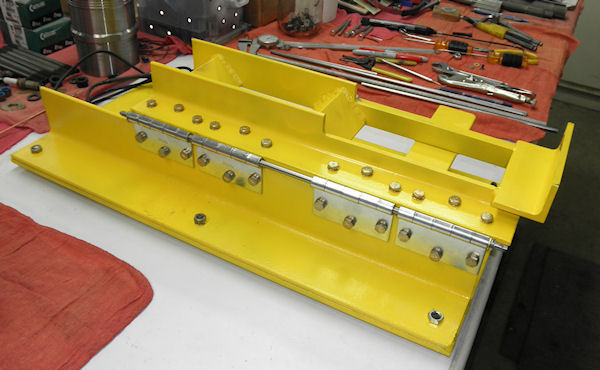
Figure 1 - Engine Mount Assembly
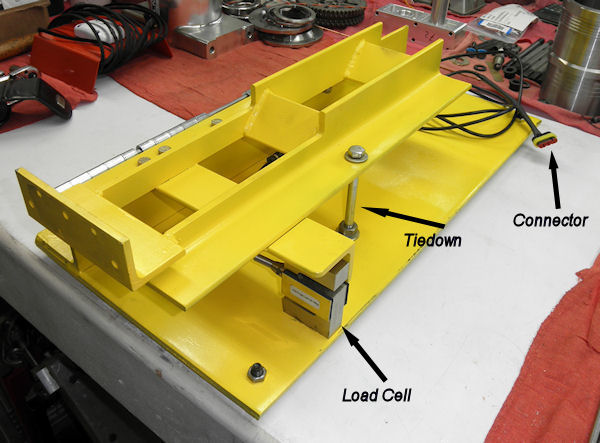
Figure 2 - Engine Mount Assembly and Components
DATA ACQUISITION SYSTEM
The Data Acquisition System ("DAQ") has been designed to capture and display in real time the 21 parameters of interest to this engine development program, to record those data at 1/2 to 1 second intervals, and to download the recorded data to allow for subsequent analysis and charting functions.
The parameters and their expected limits are:
- Torque: 750 lb-ft.
- Gas Generator Speed: 0 to 95,000 RPM.
- Output Shaft Speed: 0 to 3600 RPM.
- Airflow: 0 to 950 grams / sec (approximately 2.09 lbm/sec)
- Fuel Flow: 0 to 160 lbm per hour.
- P0 (ambient / compressor inlet) pressure): 0 to 32 psi absolute
- P3 (compressor discharge pressure): 10 to 85 psi absolute
- P5 (interstage pressure):10 to 100 psi absolute
- Oil Pump Output Pressure: 0 to 150 psig.
- Fuel Delivery Pressure: 0 to 150 psig.
- Ambient Air Temperature: 0 to 120°F.
- Compressor Discharge Temperature: 30 to 625°F.
- Recuperator Gas Discharge Temperature: 30 to 625°F.
- Interstage Temperature #1: 30 to 1800°F.
- Interstage Temperature #2: 30 to 1800°F.
- Recuperator Gas Inlet Temperature: 30 to 1800F.
- Exhaust Gas Exit Temperature: 30 to 1800F.
- Engine Core Temperature (near rear bearing): 30 to 800°F.
- Oil Temperature ( heat exchanger inlet): 10 to 260°F
- Oil Temperature (heat exchanger outlet): 10 to 260°F.
- Fuel Temperature (at fuel shutoff valve): 30 to 150°F
The Data Acquisition System (DAQ) is based around the SkyView Flight Management system by Dynon Avionics. This system is extremely configurable by means of various tables and equations. Among the many aircraft functions the SkyView can perform, it can monitor and record, in real time, as many as 32 engine parameters, by means of the Dynon Engine Monitoring System (EMS) interface.. Each EMS can connect as many as 14 analog sensor inputs, six pulse inputs, six "J" type thermcouples (range -346 to 1400°F) and six "K" type thermcouples (range -454 to 2300°F).
The DAQ computer incorporates calibrating and linearizing polynomials for each type of sensors that SkyView supports. The sensors chosen are, for the most part, from the SkyView library. EPI has calibrated and developed linearizing polynomials for the few selected sensors which were not in the SkyView library.
We have configured the SkyView to display, in real time, all the measured parameters, both graphically and numerically. The following picture shows the screen presentation captured during one of our test sessions. This presentation is discussed further under the picture.
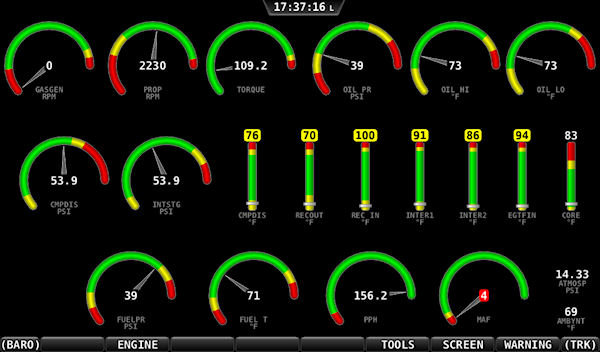
Figure 3 - DAQ Display
The top row of gauges, L-to-R, displays Gas Generator RPM, Propeller RPM, Measured Torque (Lb-Ft), Oil Pressure (PSIG), Oil HX inlet temperature (Oil Temp HI,°F) and Oil HX exit temperature (Oil Temp LO, °F ).
NOTE that in this picture, the Gas Generator RPM is zero because we did not have that sensor attached to the system, (The displayed torque and Prop RPM calculate to 46.4 HP.)
The middle row, L-to-R, displays Compressor Discharge Pressure (PSIA), Interstage Turbine Pressure (PSIA), and the seven thermocouple temperature readings (all °F): Compressor Discharge, Recuperator Out, Recuperator In, Interstage #1, Interstage #2, Engine Exit EGT and Engine Core.
The bottom row shows Fuel Pressure (PSIG), Fuel Temperature (°F), Fuel Flow (PPH), Compressor Inlet Mass Airflow (grams / sec), Ambient (atmospheric) Pressure ( PSIA) and Ambient Temperature (°F).
Real time (shown center top) is derived from a GPS antenna connected to the system. That allows automatic time and date stamping of all collected data.
The colored areas on each graphical gauge display depict normal (green), caution (yellow) and danger (red) operating regions.
Whenever a parameter is in a defined YELLOW zone, the digital value on screen is shown with a yellow background, as shown on 6 of the 7 thermocouple gauges (Figure 3), as well as the oil pressure and both oil temperature gauges.
Whenever a parameter is in a defined RED zone, the digital value on screen is shown with a red background (example - see MAF in Figure 3). In addition, each sensor can be configured to generate an alarm signal if the parameter goes into the red zone. When any alarm condition occurs, the WARNING text in the lower right corner of the screen flashes red.
Because this WARNING alert is somewhat obscure and not always in the peripheral range of the operator, we built an External Alarm Box which can be placed near the engine to better catch the operator's attention if an anomaly is detected. That box is discussed later in this presentation.
Figures 4 and 5 below show a front and rear view of four of the major components of the DAQ system. In the foreground of Figure 4 is the SkyView computer, mounted in a cabinet we built to transform it from an aircraft panel-mount instrument into a desktop / laptop console. Behind the console are (left to right) are (a) the GPS antenna, (b) the load cell amplifier box, and (c) the Dynon EMS sensor interface box.
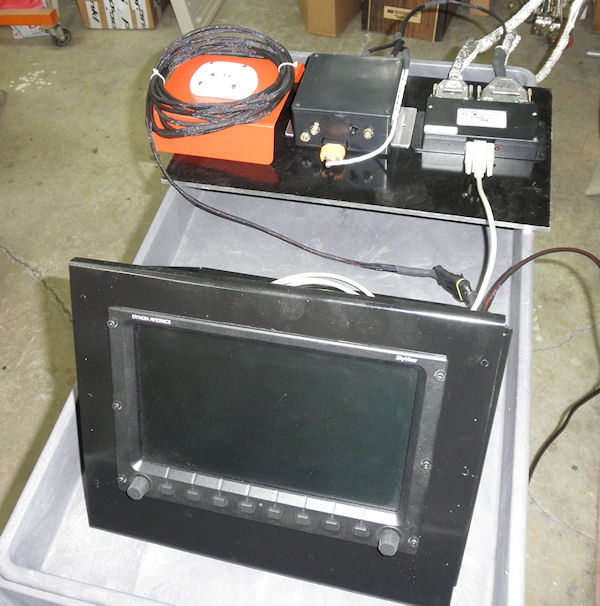
Figure 4 - Console and Sensor Interfaces - Front
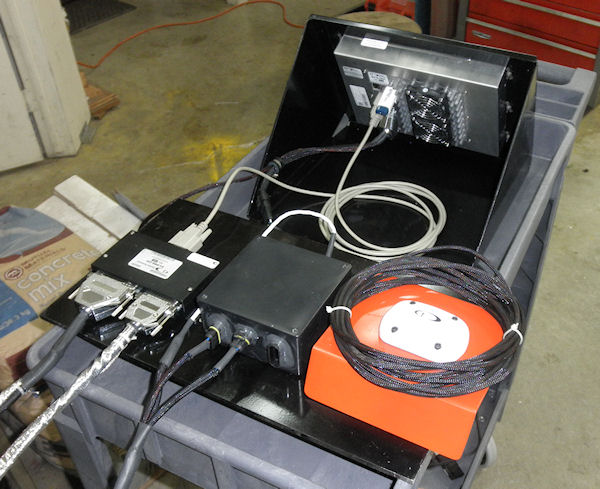
Figure 5 - Console and Sensor Interfaces - Rear
Note in Figure 5 the memory stick inserted in one of the USB ports in the rear of the console. The operator can select and output to the memory stick sets of data captured and recorded from various test runs.
The black box at the lower left of Figure 5 is the SkyView EMS interface box. The leftmost of the two cables attached to the rear of the EMS connects all the sensors except for the thermocouples. The other cable connects all the thermocouples to the system with specialized thermocouple wire. Each of the two sensor cables is approximately 6 feet long, which requires that the EMS box and the amplifier box are mounted in a location fairly close to the test stand / dyno.
Figure 6 below shows a different view of the EMS box (lower center), the thermocouple cable group (left), the sensor cable group (right), the load cell amplifier box (upper left) and the system remote operator alarm (upper center).
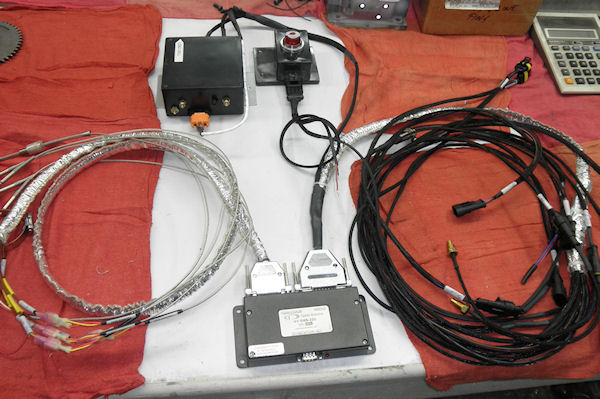
Figure 6 - EMS, Sensor Cables, Amplifier Bos, Alarm Box
The EMS connects to the SkyView through 50-foot long RS-232 cable, which allows the system DAQ console to be conveniently remoted from the engine test stand and dyno.
The black box to the right of the EMS houses the amplifier for the load cell wheatstone bridge, and also houses the outside air temperature and pressure sensors. The empty connector on the rear of that box is the socket for the cable from the Dyno load cell.
The orange component is the GPS antenna for the system on a tray that can easily be positioned in a convenient spot to see GPS satellites. There is a 16 foot cable which connects the GPS antenna to the system, allowing for easy placement of the antenna in a spot where it can easily acquire a suitable satellite view.
The system operates on a 12V DC supply. The power supply cable has been equipped with a switch-controlled cigarette-lighter male adapter to simplify the use of a vehicle as the test operation facility, pictured in Figure 7 below.
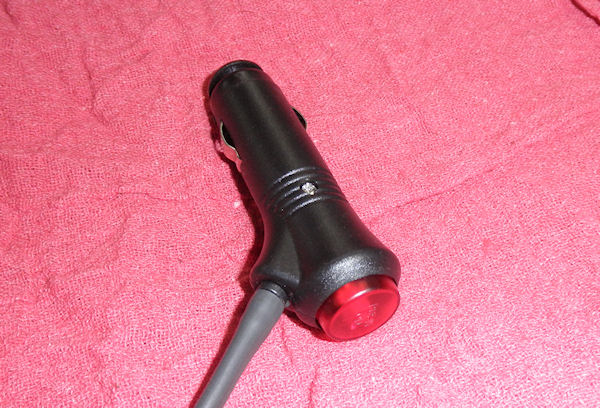
Figure 7 - Dyno System Power Plug / Switch
All the sensors in the system have dedicated return wires, so there is no ground connection between the engine and dyno system required (or desirable). The assumption has been made that the engine starter system and electrical accessories (pumps, etc) will operate from a dedicated battery, separate from the DAQ power supply.
SENSORS
Most of the sensors used in this system are supplied by Dynon Avionics as part of the EMS package. Dynon has calibrated their sensors and incorporated the appropriate (up to 4th order) linearizing polynomial into the SkyView software. For sensors not provided by Dynon, we have run calibration procedures and generated the appropriate linearizing polynomials, and incorporated them into the SkyView software.
TORQUE
Engine output torque is measured by means of a calibrated Futek Technology 500 Kg "S"-beam load cell. The load cell is connected to a two-channel instrumentation amplifier. The output from the amplifier is fed to one of the SkyView input channels, and calibration information for that amplifier and load cell are incorporated into a 4th order polynomial which has been fit to the torque output curve. The load cell pickup point is located 8.260 inches (0.688 feet) from the center of the engine mount pivot axis. Therefore the theoretical torque capacity of this setup is 757 lb-ft at the 500 Kg load cell limit..
The following pictures show the calibration setup for the torque measurement system, using a series of accurately measured weights and a lever arm with a load tray suspended a known distance from the dyno hinge centerline.
The calibration shown here took into account the weight of the arm and weight tray, so the zero point as delivered reflects the static moment applied by the weight of the pivoting engine mount. After the engine, gearbox, propeller and all other equipment are mounted on the dyno, a new zero point will be determined and entered into the system.
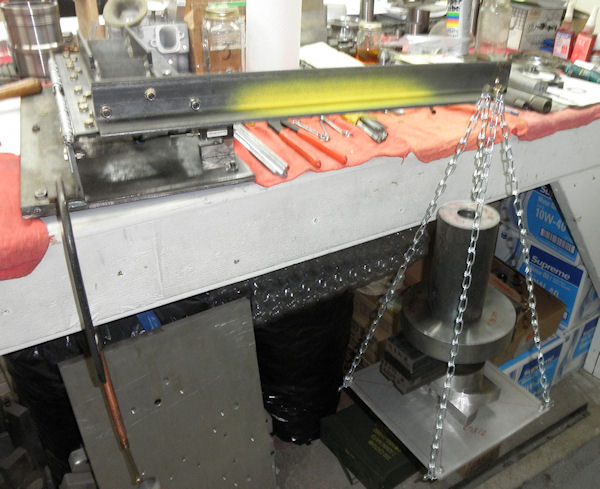
Figure 8 - Load Cell Calibration
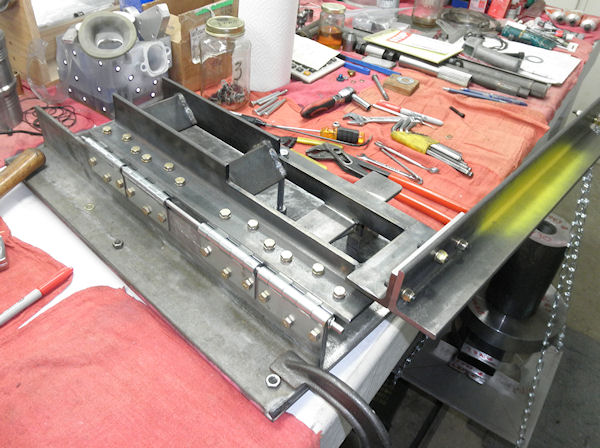
Figure 9 - Load Cell Calibration
The load cell amplifier is contained within its own protective box, which has a convenient mounting bracket attached to the bottom. This box also contains the ambient pressure and temperature sensors. This picture shows the contents of the amplifier box.
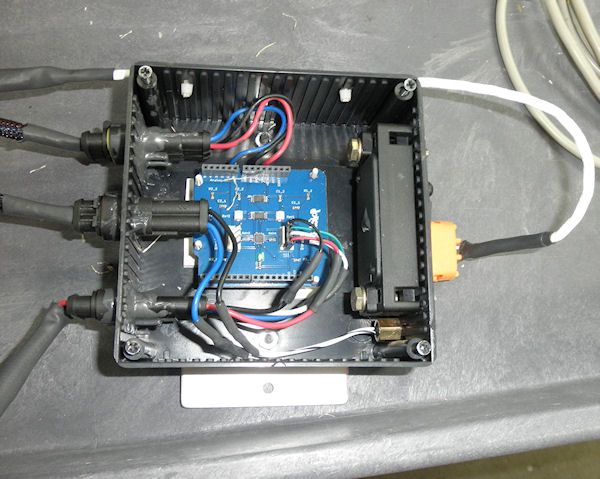
Figure 10 - Load Cell Amplifier and Ambient Pressure and Temperature Sensors
The socket on the lower left (in the picture) is the connector from the Dyno load cell. The middle connector on the left side is for the ambient air temperature sensor. The top left connector is the amplifier output to the SkyView. The connector on the right is for the ambient pressure (P-zero, or P0) sensor.
The cable from the EMS box to the amplifier box is 30 inches long, which allows for flexibility of placement.
GAS GENERATOR RPM (N1)
The engine designer must provide a pulse transducer in the gas generator section to measure the RPM. That sensor is "open-collector" interfaced and must contain its own internal pullup resistor. The DAQ sensor cable cluster contains a cable to which the existing N1 sensor can be attached.
The N1 cable has a red, a black and a blue wire which connect to the sensor's 5v, ground and signal terminals respectively.
PROPELLER RPM
Figure 11 below shows the detail of the propeller RPM sensor. It is approximatelt 1.825 in length, with the length of the threaded portion is approximately 1.425. The thread is a 12Mx1.0
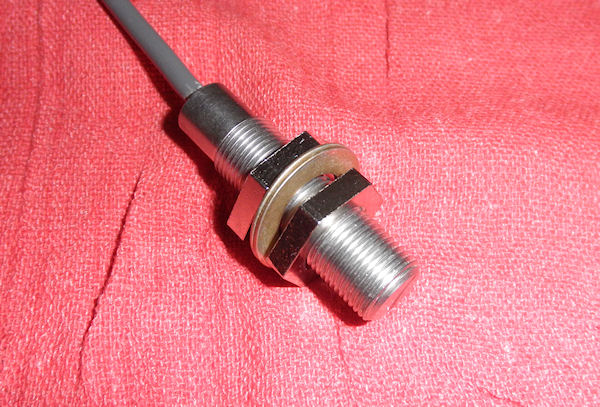
Figure 11 - Propeller RPM Sensor
This is a hall effect transducer which contains the appropriate pullup resistor internally. It has been tested and calibrated using a 39 tooth gear turning at speeds from 600 to 1800 RPM, as shown in Figure 12 below.
The sensor supplied with mounting nuts and washers as shown, so the installer can fabricate a bracket which will locate the sensor in close proximity to a ferromagnetic trigger which passes the sensor a known number of times per revolution of the propeller.
The system, as delivered, is programmed for six pulses per revolution in anticipation that the sensor can operate off the edges of the propeller attach bolts or nuts. That can be easily changed to accommodate a triggering system which might be more convenient to fabricate and / or install.
For reliable operation, the face of the Prop RPM sensor must be no further than 0.050 from the ferromagnetic triggering components.
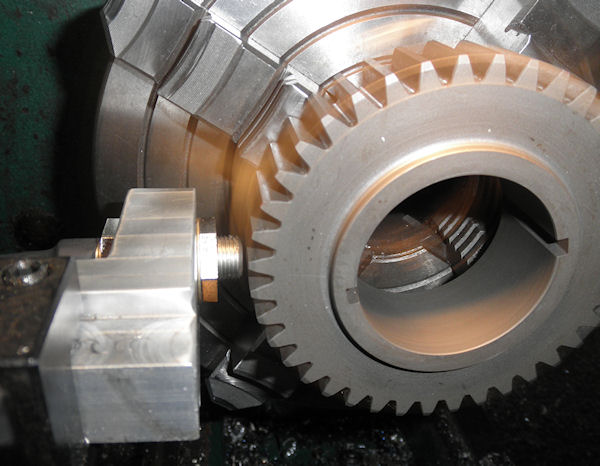
Figure 12 - Propeller RPM Sensor
ENGINE AIRFLOW
The sensor used to measure the mass flowrate of air into the compressor section is a Denso 197-6040 analog-type automotive mass airflow sensor, shown in Figure 13.
As installed in its automotive applications, that sensor is not calibrated to measure the magnitudes of airflow that a turbine engine ingests. However, the sensor works on the principle that as the mass flowrate of air over the sensing element varies, the sensing element must be provided with a correspongingly variable amount of current in order to maintain a target temperature.
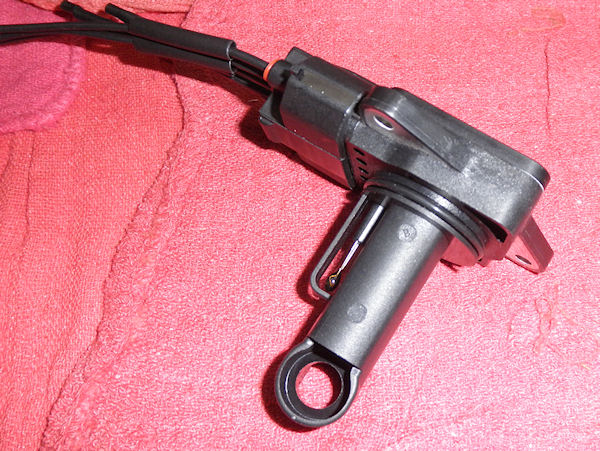
Figure 13 - Engine Mass Airflow Sensor
Based on that operating principle, we tested the prototype sensor on our airflow bench (Figure 14), and measured the volume flowrate through the
fixture at various appropriate pressure differentials. Using the known cross-sectional flow area of the fixture and the ambient conditions, we generated a curve of
sensor output voltage as a function of mass flowrate through the fixture. From those data, we generate and install the mass airflow calibration curve appropriate for
the cross sectional area of the engine inlet duct where the sensor will be mounted.
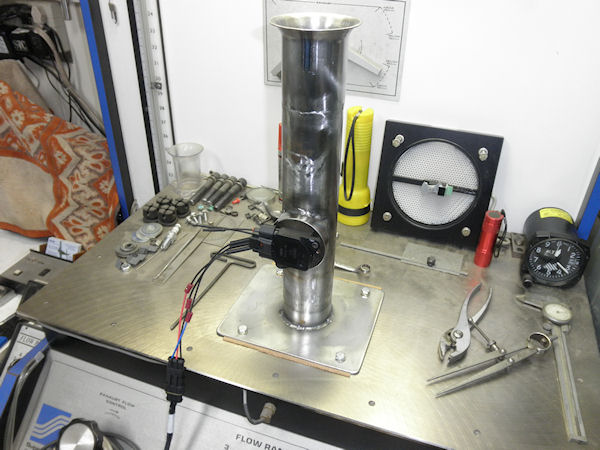
Figure 14 - Engine Mass Airflow Calibration
FUEL FLOW, FUEL PRESSURE and FUEL TEMPERATURE
For engine characterization and development purposes, the fuel consumption metric of interest is BSFC, which is the mass of fuel consumed to produce a given amount of power. Conventional fuel flow sensors typically report flow in volume units (gallons per hour), and in general, are not acceptably accurate over a reasonable range of fuel flow values.
For this dyno, we selected a fuel flow measurement system which uses a conventional vane-type flow sensor. Those sensors have, by nature, large nonlinearities. However, the manufacturer recognized the accuracy problem, and built a microcomputer / gauge interface which contains the necessary logic to linearize the sensor measurements. That interface outputs a programmable pulse rate which is linear within 1% across the expected range. That linearized pulse rate is the fuel flow input signal to the DAQ.
However, we need to determine the fuel mass flowrate. Since the density of fuel varies with fuel temperature, weI have incorporated a fuel temperature sensor into the fuel system, and that will be used during post-processing of the collected data to calculate the corrected mass flowrate from the measured volume flow rates.
ASTM Specification D1655-04a lists the density of Jet-A1 at 15°C as a range from 6.468 lb/gal (775 Kg/M³) to 7.008 lb/gal (840 Kg/M³). For the initial DAQ configuration, we have used the average of those two extremes (6.739 lg/gal). That figure is easily modified to conform to the measured density of the fuel being used for a given test.
Figures 15, 16, and 17 below show the complete fuel subsystem supplied with the dyno. That subsystem consists of the fuel flow sensor and the linearizing interface box, a low-restriction filter on the inlet side of the sensor, a manifold block on the outlet side of the sensor which contains the fuel pressure and fuel temperature sensors and the fuel shutoff solenoid.
The sensor, filter and manifold block are all mounted on a convenient base plate. IT IS IMPORTANT TO NOTE THAT THE FLOW SENSOR (shown horizontal in Figure 13) MUST BE MOUNTED IN AN ORIENTATION AS CLOSE TO VERTICAL AS POSSIBLE. IT IS INTENDED THAT THE BASE PLATE BE ATTACHED TO THE PANEL ON THE SIDE OF THE ENGINE PYLON IN THE VICINITY OF WHERE THE CURRENT FLOW SENSOR IS LOCATED.
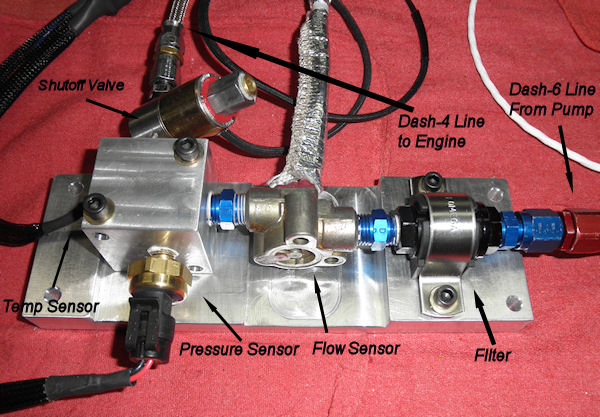
Figure 15 - Fuel Flow Sensor, Filter, Temp & Pressure Sensors, Shutoff Valve and Base Plate
NOTE that the12 VDC fuel shutoff solenoid must be wired into the engine control system as part of the dyno installation process.
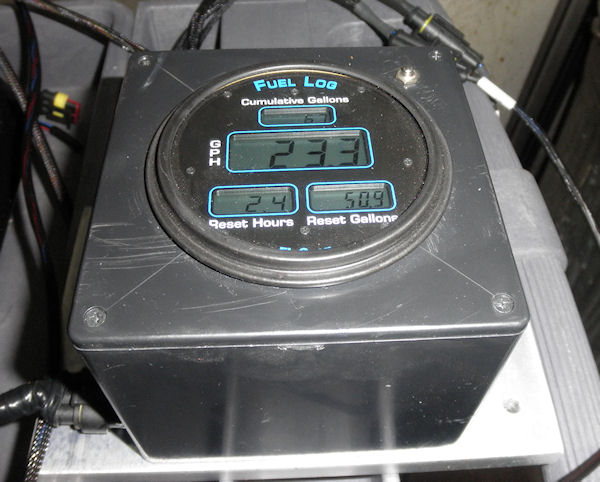
Figure 16 - Engine Fuel Flow Interface
The fuel flow linearizing logic is part of a stand-alone fuel flow display, pictured above in Figure 16. We have incorporated this gauge into a conveniently-mountable box as shown, with interfacing cable connections (marked) from the flow sensor and to the DAQ sensor cable cluster.
Note that the gauge displays instantaneous fuel flow volume (GPH) as well as a cumulative power-on time counter and a cumulative fuel flow value. Although this box is near the engine (hence remote from the operator), it might provide some useful information to corroborate other data. We have provided a convenient reset pushbutton (upper right hand corner of the box, above) which, when held depressed for 10 seconds, will clear the cumulative displays back to zero.
Figure 17 shows (somewhat blurred, sorry) all the fuel subsystem components except the interface box.
The long upper hose is an Aeroquip braided Dash-6 line which goes from the fuel tank outlet to the fuel pump inlet. It includes the appropriate 1/2 NPT fittings and AN adapters at the tank end, and the appropriate AN-to-M10x1.0 adapter at the fuel pump end.
The hose attached to the fuel filter goes to the outlet of the fuel pump. It has an AN-to-M10x1.0 adapter at the fuel pump end.
The braided hose attached to the shutoff valve is a Dash-4 braided fuel delivery hose to the engine. At the engine end, it has a Dash-4 to 1/8 NPT adapter. There is another braided line included which is not shown. It is a pair of Dash-3 braided lines to be used for the startup fuel supply plumbing.
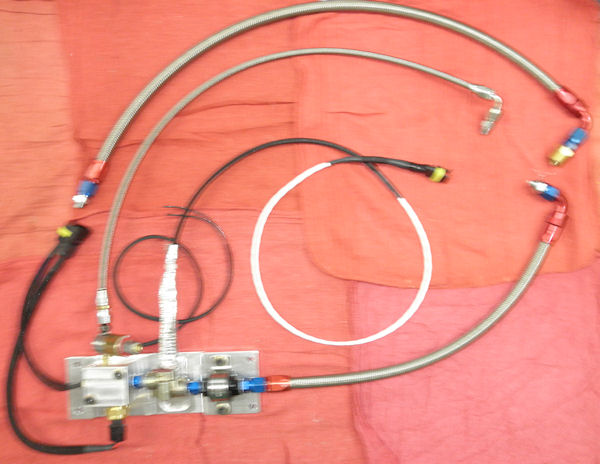
Figure 17 - Engine Fuel Flow Subsystem Components
NOTE:
NEVER ! NEVER ! NEVER ! USE TEFLON TAPE IN OIL OR FUEL SYSTEM PLUMBING.
To seal tapered pipe threads, use LOCTITE 567 or a proven equivalent.
AMBIENT PRESSURE (P0)
This sensor is a GM manifold absolute pressure (MAP) sensor with a 2.0 bar-absolute range. As mentioned above, this sensor is installed in the load cell amplifier box.
NOTE: Tthe ambient pressure port (shown) needs to be protected from any external air velocity to assure its accuracy when the engine is operating.
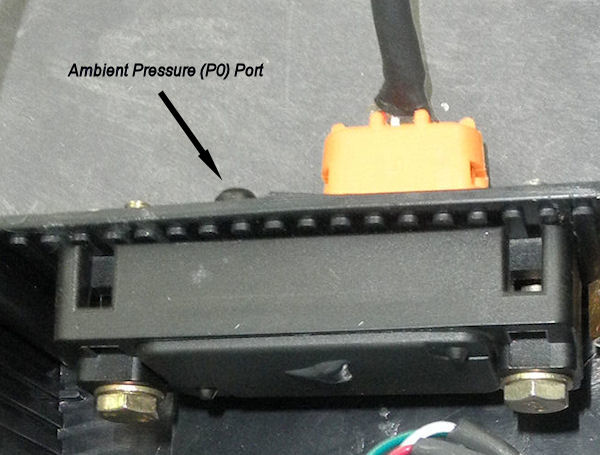
Figure 18 - Ambient Pressure Sensor
COMPRESSOR DISCHARGE PRESSURE and INTERSTAGE TURBINE PRESSURE
These parameters require measuring the pressure of gasses that are at elevated temperatures. For that task, we selected the U7139-150-PA-5W stainless steel high temperature transducer from Measurement Specialties. In order to protect the transducers from extreme temperatures, we fabricated isolation adapters which use a stainless steel tube having an 0.063 inside diameter and attach to special fittings that will screw into the pressure taps on the engine. At the end of the small stainless tube is a 6" section of a larger stainless tube which connects to the sensor adapter through an orifice of 0.039" diameter.
One sensor is shown in Figure 19. The complete isolator adapters are shown in Figures 20 and 21.
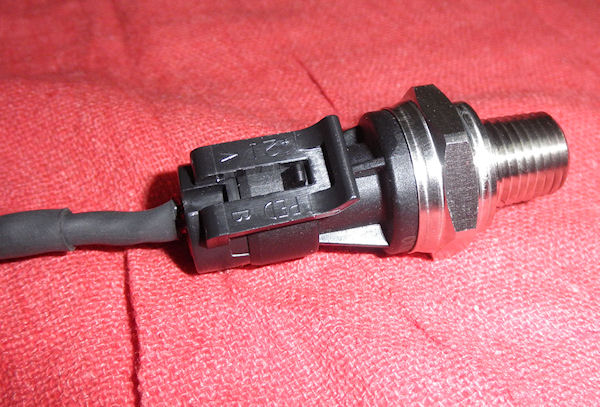
Figure 19 - Pressure Sensor for High Temperature Fluids
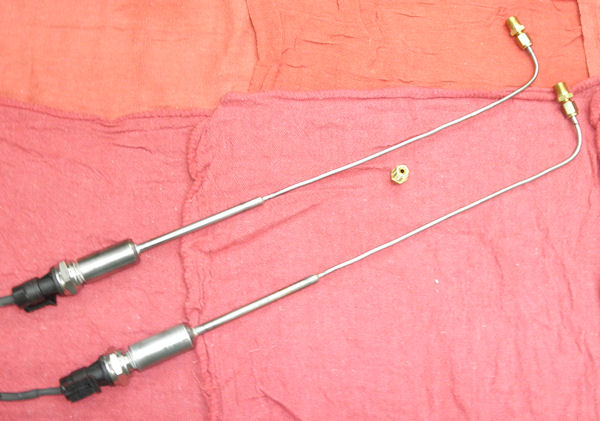
Figure 20 -Sensor Isolator Adapters
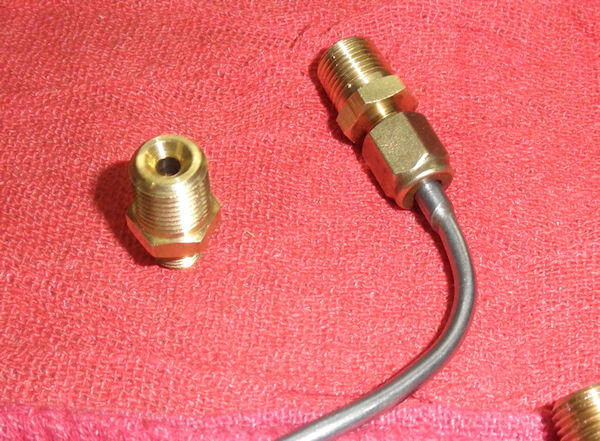
Figure 21 - Sensor Isolator Tube Ends and 1/8 NPT Fitting
OIL PRESSURE and FUEL PRESSURE
These sensors are 150 PSIG Kavlico 5000 series sensors, supplied by Dynon. The sensors have a 1/8-27 NPT male thread. The fuel pressure sensor is already fitted to the fuel flow sensor, but the oil pressure sensor needs to be installed at the output of the engine oil pump.
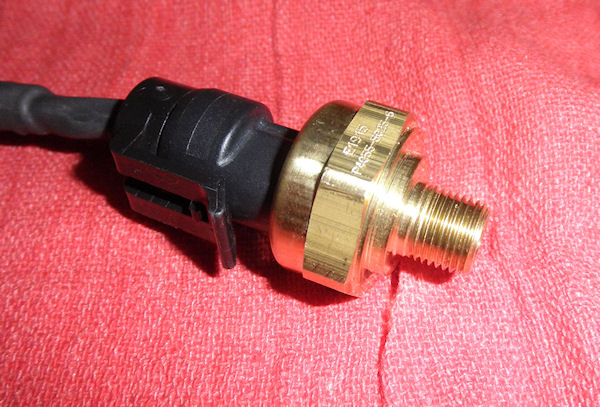
Figure 22 - Oil-Fuel Pressure Sensor
AMBIENT AIR TEMPERATURE
This sensor is a Dynon-supplied inlet air temperature sensor normally installed in the inlet duct of recip aircraft engines. This sensor is mounted in the load cell amplifier box as shown in Figure 10.
COMPRESSOR DISCHARGE and RECUPERATOR DISCHARGE TEMPERATURES
The expected temperature ranges for these parameters make a "J" type thermocouple appropriate. The engine designer has stated that he will provide these thermocouples so as to suit the installation requirements. The DAQ cables for those thermocouples are labelled and appropriate wire connectors are provided.
INTERSTAGE, RECUPERATOR INLET and FINAL EXHAUST GAS TEMPERATURES
These parameters are suited to a high quality "K" type thermocouple such as pictured below and supplied by Dynon Avionics. They were originallt intended as EGT sensors (evident fromthe picture) but can easily be adapted to be held in place either by additional clamp bands or by removing the existing bands and using custom-made clamping fingers.
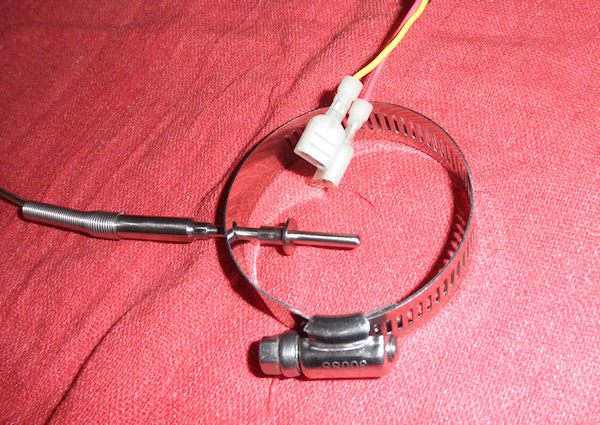
Figure 23 - System "K" Thermocouple
ENGINE CORE TEMPERATURE
This temperature will be measured as close to the free turbine support bearings as possible. The expected temperature range (900 °F) makes it well suited to the "J" type thermocouple configuration which Dynon Avionics has developed to measure cylinder head temperatures in recip engines. It consists of a shielded "J" TC mounted with a spring on the shielded cable. The adapter is a bayonet-type connector which mates with the 3/8-24-threaded receptacle (shown disconnected in Figure 25). The required spring force is obtained by threading the bayonet connector up or down the spring.
The linear range of the connector on the spring is approximately 4.25 inches. The probe and spring fit into a 0.265 diameter hole, drilled to a depth that brings it close to the bearing bore in the housing. The top of that hole is then tapped to 3/8x24, and the threaded adapter installed.
-01s.jpg)
Figure 24 - Engine Core Thermocouple
-02s.jpg)
Figure 25 -Engine Core Thermocouple
OIL and FUEL TEMPERATURES
The oil and fuel temperature sensors are 2-wire UMA 1B1 sensors, selected from the Dynon Sensor Library. The sensors have a 1/8-27 NPT male thread. One (the "OIl Temp-Hi" sensor) will be installed on the inlet side of the engine oil heat exchanger and the other will be installed on the exit side of the heat exchanger.
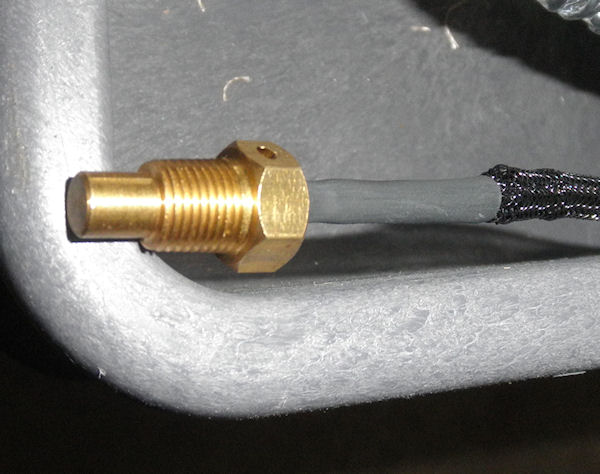
Figure 26 - Oil Temp Sensor
REMOTE OPERATOR ALARM
As mentioned earlier in this presentation, each sensor can be configured to generate an alarm signal if the parameter goes into the red zone. When any alarm condition occurs, the WARNING text in the lower right corner of the screen flashes red.
Because this WARNING alert is somewhat obscure and not always in the peripheral vision range of the operator, we built an External Alarm Box (Figure 27) which can be placed near the engine to better catch the operator's attention if an anomaly is detected.
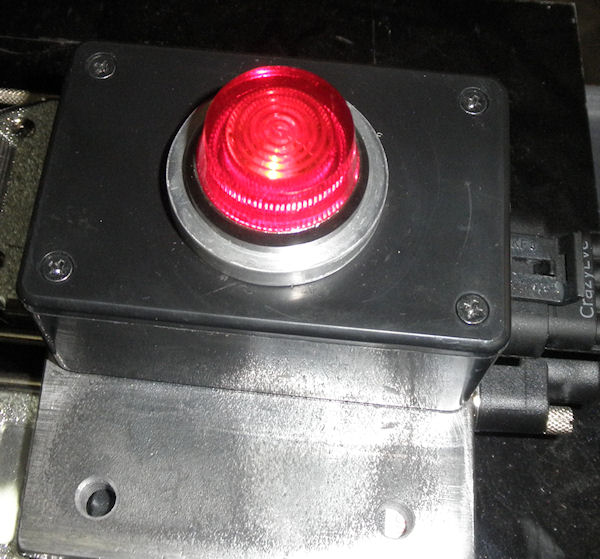
Figure 27 - Remote Operator Alarm
As shown, the Alarm Box has a convenient steel mounting plate, so it can be attached to a surface where it will be visible to the operator.
The alarm is triggered by the DAQ, but there is not sufficient available power to drive the light. Therefore, the light must be supplied with a separate external source of 12 VDC power. Figure 28 shows the available wiring stubs for this required external power.
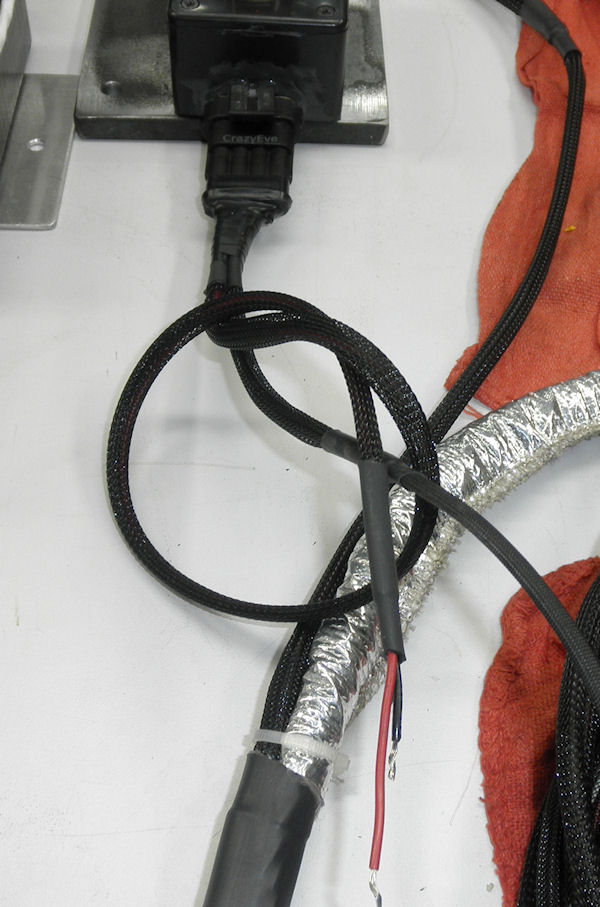
Figure 28 - Remote Operator Alarm Required Power Wiring
WE SUGGEST THAT THE ALARM POWER SUPPLY BE WIRED TO THE SAME SWITCH THAT OPENS AND CLOSES THE ENGINE FUEL SHUTOFF VALVE. THAT ELIMINATES THE ANNOYANCE OF HAVING THE ALARM LIGHT FLASHING WHILE WORK IS BEING DONE ON THE TEST STAND, AND THE ALARM WILL ONLY BE ACTIVE WHEN THE ENGINE IS RUNNING.
INSTALLATION ITEMS
The following is a list of items that need to be accomplished as part of the dyno installation process.
- Unpack and inspect the various components of the system. Check out the various cable lengths and formulate appropriate locations on the pylon for the EMS, Amplifier Box, and Remote Alarm Box. Examine all sensors and formulate appropriate attachment strategies.
- Install the EMS, Amplifier Box and Alarm Box on the pylon and suitably support all cables to prevent flapping or damage from the prop slipstream.
- Install the engine onto the mount using the front (gearbox) mounting bolts, while at the same time supporting the aft end of the engine in correct horizontal alignment. Locate the side bolt mounting holes and mark their location. Remove the mount from the base by removing the full length hinge pin. Fixture the mount in a milling machine and mill two slots a few thousandths wider than the side bolt diameter, and approximately 2xDiameter in length. Those slots will allow for the inevitable differential expansion due to temperature changes when the engine is in extended operation.
- While the mount is removed from the base, place the base on top of the pylon in its preferred location and drill the four holes for the attachment bolts. Remove the base and clean away any slivers or drilling debris. Replace the base and Install the four mounting bolts (no nuts at this time) and measure the clearance between the four corners of the base (near the attachment holes) and the top surface of the pylon. Insert shims under any corner that is not touching the pylon top surface to preclude any distortion of the mount structure when it is tightly bolted into place. (Any distortion will put a bind on the hinge mechanism and affect the accuracy of the torque measurements.)
- Revise the existing engine fuel input ports (main and starting) to accept 1/8 NPT-male adapter fittings.
- Install the dyno fuel system. it was designed with the idea in mind that it would go on a pylon side panel with the sensor axis as close to vertical as possible. (An angled sheet metal bracket here would be helpful to locate the sensor axis in the vertical plane). Braided AN hoses and appropriate fittings are included with the dyno to provide complete lines from the tank to the engine. There are also two extra Dash-3 braided lines to use for the starter fuel circuit plumbing.
- Install the appropriate pressure taps to measure P3 and P5, to accept the 1/8 NPT-male sensor adapter fittings.
- Connect the N1 sensor to the appropriate DAQ cable.
- Fabricate a fixture to locate the Prop RPM sensor in a spot where it can be triggered at least once per revolution. Observe the 0.050 MAXIMUM separation criterion.
- Drill and tap (1/8 NPT) ports for the two oil temperature sensors (hot side and cold side of the oil cooler) and install the sensors. DO NOT drill or tap any oil system fittings when they are installed on the engine due to a severe risk of oiul system contamination with metal debris.
- Install appropriate thermocouples and attach to the appropriate (labelled) DAQ cables. Crimp connectors to fit the DAQ thermocouple terminations are included in the shipment.
- Provide switched 12 VDC power (independent and separate from the Dyno power suply) to the fuel shutoff solenoid valve and the remote alarm box.
DYNO SYSTEM OPERATION
This section provides some basic insights into the operation of the Dyno system.
There are eight pushbutton switches (Figure 4) along the bottom edge of the DAQ computer screen. In several of the instructions, they are referred to by number, 1 to 8, left to right.
At the lower left and right corners, there are buttons ("cursor toggle buttons") which can be rotated in either direction to make menu selections, and can be deflected left / right / up / down, also to make menu selections. Which technique to use is often an item of operator preference.
Prior to startup, position the GPS antenna so it has a clear view of the sky. One suggested location is on the hood of the operations vehicle.
Prior to engine start, be sure that the engine mount lockdown bolt is released. Just a few thousandths of clearance is all that is required.
Once the system has been fully installed, insert the Power Adapter / Switch (Figure 7) into the lighter outlet of the operations vehicle. Push the red switch to apply power to the system. The red light in the button will illuminate to confirm power is on.
The system takes about 30 seconds to boot, and it can take as much as two minutes for the GPS to lock on and set the system time.
The system is operational when the DAQ display shows the display pictured in Figure 3 above. If there is a large "X" through any of the sensor displays, that indicates there is a problem with the interface to that sensor. Check plugs and sockets first.
SAVING DATA LOG FILES
In order to output the data files captured during a run, first insert a FAT-formatted USB memory stick into one of the two USB ports on the rear of the DAQ computer. Next, depress and hold switches 7 and 8 simultaneously. A popup box will say HOLD TO ENTER SYSTEM SETUP. After about 3 seconds, the following screen will display:
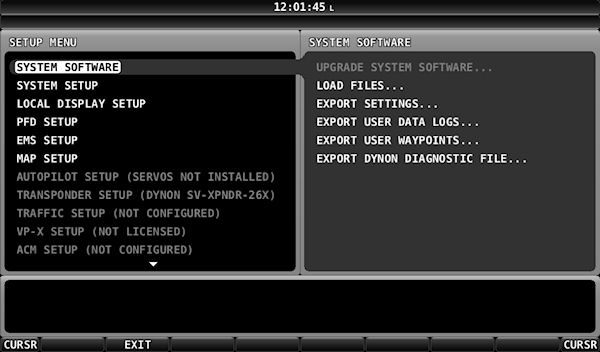
Figure 30
Use one of the cursor toggle buttons to move the cursor right. That moves the right halfscreen shown in Figure 30 into the left halfscreen (active) position.. Use the cursor toggle button to move the cursor down to the EXPORT USER DATA LOGS position, shown below in Figure 31.
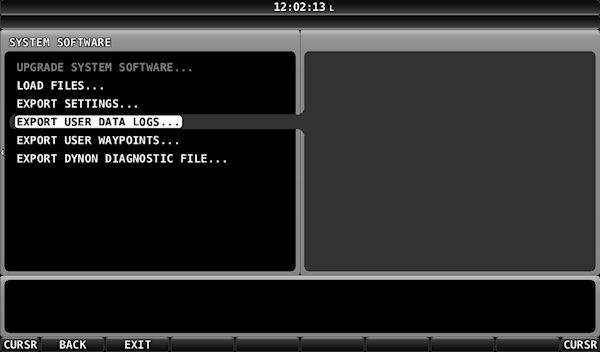
Figure 31
Toggle the cursor right and the screen shown in Figure 32 will display. Note the white box cursor in the first position of a 10-character user text field. The operator uses that field to uniquely identify the group of data log files being output.
The text entry is done by rotating one of the cursor toggle buttons, causing the 26 alpha and 10 numberic characters to scroll through the selected position. When the desired character is displayed, toggle right to select the next character position. When the desired label has been entered, push the EXPORT button and the data files will be written to the stick.
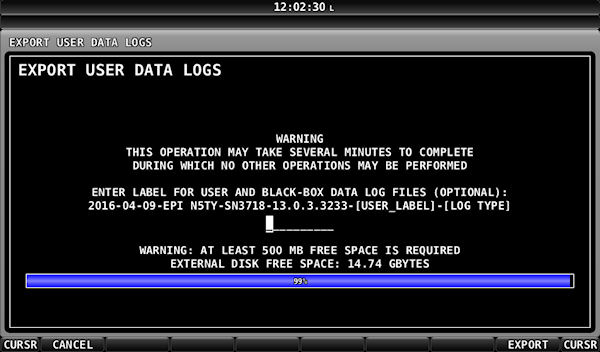
Figure 32
Remove the stick and email the files to EPI for postprocessing.
After being certain that the logs have been emaied, the existing data logs should be cleared to avoid processing and storage for old data. To clear the data logs, navigate to the SETUP menu (Figure 30), select SYSTEM SETUP, then DATA LOG SETUP, then CLEAR ALL DATA.
SAVING CONFIGURATION FILES
In order to export and save the two DAQ master configuration files, insert an appropriate memory stick into one of the USB ports and enter the SETUP screen (as described above Figure 30). Toggle right one, down 2 to the EXPORT SETTINGS display (Figure 32).
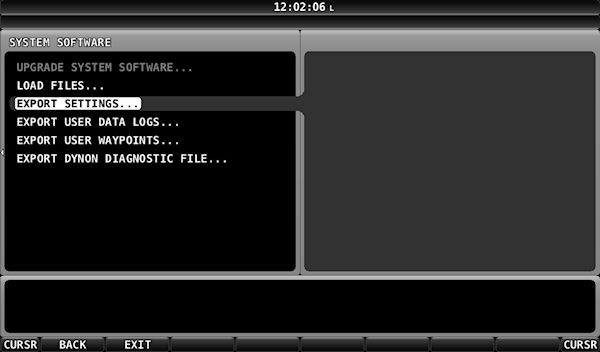
Figure 33
Toggle right and the following screen will display. Enter the identifying text (as described above Figure 32) and press the EXPORT button. The files will be written to the stick.
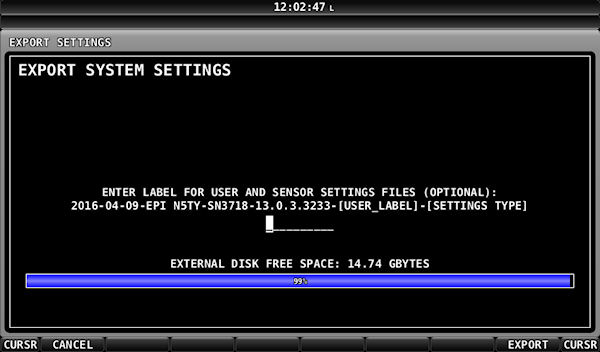
Figure 34
LOADING NEW CONFIGURATION FILES
Occasionally it will me necessary for EPI to update the system configuration to meet evolving needs. In that case, EPI will email the appropriate files to the operator. The operator should copy the file (or files) to the root directory of an appropriate memory stick, and insert that stick into one of the DAQ USB ports.
Enter the SETUP screen (as above) and toggle right one and down one to display the following screen:
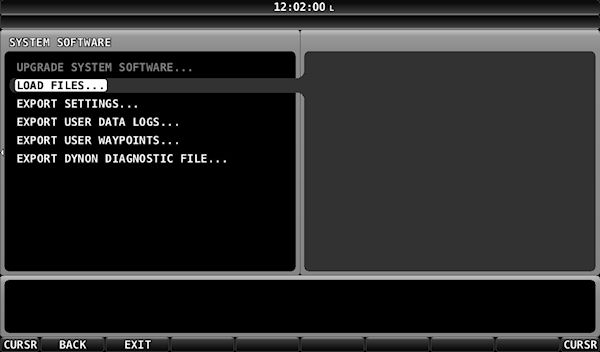
Figure 35
Toggle right one and a screen showing the DAQ files in the root directory of the stick will display. The picture below is an example of such a display. Use the
down-toggle to select the file to be loaded, and press the LOAD button. A confirmation popup will display. Confirm the operation and the file from
the stick will replace the one currently in DAQ memory.
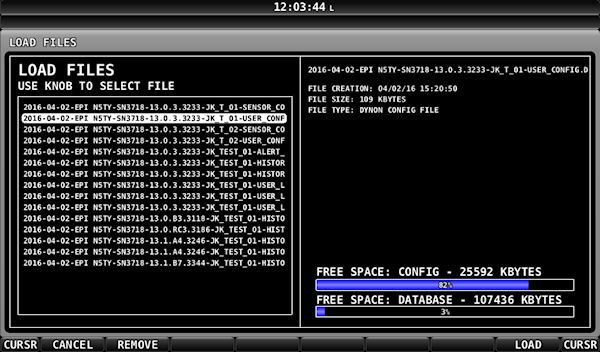
Figure 36