- Loads on the Secondary Shaft -
Values Required for the Stress Analysis
NOTE: All our Products, Designs, and Services are SUSTAINABLE, ORGANIC, GLUTEN-FREE, CONTAIN NO GMO's, and will not upset anyone's precious FEELINGS or delicate SENSIBILITIES
The preceding pages in this section showed how the static and dynamic properties of each major component of the secondary drive system were determined. This page draws from those calculations to give a description of the various loads imposed on the Factory 35-mm secondary shaft by the system components, and to explain why the shafts fail. The loads, stresses and deflections shown here were calculated for the max and cruise conditions defined on the Summary of Shaft Loads page.
It is our opinion that the 30mm shaft is not adequate for the task in any of its configurations (3-bearing, 2-bearing or spherical bearing), so the focus of this presentation is the factory 35mm shaft.
The picture below is a representation of the deflection of the factory 35mm shaft with the ProDrive toothbelt drive system installed. The deflection shown was calculated by our FEA system, and has been multiplied by a factor of 200 to enhance the visibility of the deflections. (The colors represent the stresses on the shaft, which will be covered later.)
The relevant shaft loads are shown in their approximate locations, and identified. If you are wondering about the absence of the waterpump-alternator drive, the fan jackshaft drive, and the fan drive, they were left out because all those loads are applied in the approximately port-starboard directions, and therefore have no significant influence on the major shaft loads, which resolve to the fore-aft direction.
The torsional stress imposed on the shaft is relatively low in all conditions. The combined effect of tension, compression and torsional stress are reflected in the VonMises stress numbers in the table below.
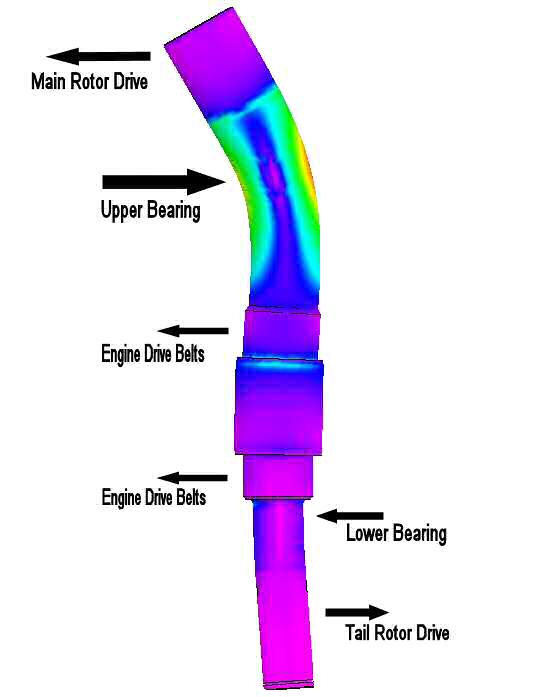
The forces which are significant to the determination of the stresses on the shaft are:
- the main rotor drive,
- the upper secondary bearing,
- the engine V-belt drive (applied essentially equally on both sides of the autorotation clutch),
- the lower shaft bearing, and
- the tailrotor drive.
This is a slight simplification of the real scenario in the sense that the loads shown are not applied exactly in the plane shown. But the resultant vector planes are very close, so no significant accuracy is lost by this approximation.
Notice how the shaft deflection changes direction. It is deflected toward the main rotor shaft at the top, straightens out through the upper bearing, deflects toward the engine below the upper bearing, straightens out through the lower bearing, and deflects toward the tailrotor at the bottom. (The deflection magnitudes are shown in the table.)
This table shows the boundary conditions for each of four different cases (chain-max, chain-cruise, belt-max and belt-cruise) with the belt preload set in accordance with Gates' recommendations for max load and using a 10:1 tension ratio, the minimum recommended preload. The table shows the results of the stress, deflection, and bearing load analysis for each case. The shaft loads are applied in the direction shown in the picture above. ("Belt" refers to the ProDrive™ toothbelt drive system; "MR" means Main Rotor.)
As previously stated, the load and stress levels shown in this table were determined using the engine mean torque at the two defined conditions (max and cruise). Therefore, there is no attempt to include the effects of engine torque spikes or system torsional vibration in these numbers. They will be mentioned later.
| Description | Chain (max) | Chain (cruise) | Belt (max) | Belt (cruise) | |
| Key Dimensions | |||||
|---|---|---|---|---|---|
| 1 | MR Drive Sprocket Pitch Dia. (in) | 3.797 | 3.797 | 3.409 | 3.409 |
| 2 | MR Drive Moment Arm (in) | 2.018 | 2.018 | 2.227 | 2.227 |
| Loads | |||||
| 3 | Main Rotor Torque (lb-in) | 3576 | 2762 | 3576 | 2762 |
| 4 | MR Torque Tensile Load (lb) | 1884 | 1455 | 2098 | 1620 |
| 5 | Total MR Drive Side Load (lb) | 2053 | 1624 | 2533 | 2508 |
| 6 | Overhung Bending Moment (lb-in) | 4143 | 3277 | 5641 | 5585 |
| 7 | V-belt Side Load, upper (lb) | 615 | 615 | 615 | 615 |
| 8 | V-belt Side Load, lower (lb) | 615 | 615 | 615 | 615 |
| 9 | Tail Rotor Torque (lb-in) | 436 | 436 | 436 | 436 |
| 10 | Tail Rotor Side Load (lb) | 239 | 239 | 239 | 239 |
| Reactions | |||||
| 11 | Upper Bearing Load (lb) | 3209 | 2591 | 4095 | 4060 |
| 12 | Lower Bearing Load (lb) | 165 | 24 | 575 | 561 |
| Max Shaft Stress | |||||
| 13 | Axial Normal (psi) | 14600 | 11600 | 21353 | 21021 |
The interesting results of the analysis are shown in lines 11 through 16 above. Note that the shaft stress level (line 13) with the belt-drive is nearly double the shaft stress level in the chain drive at cruise.
Consequently, the amount of shaft deflection and compressive stress concentration (causes of fretting) where the upper bearing is mounted are substantially greater with the belt drive. Note also that the shaft stress level in the chain drive at cruise is nearly 20% less than the stress at max power, whereas with the belt drive, the shaft stress level does not change with power (explained).
There are 3 primary reasons for the higher shaft loading in belt-drive systems, summarized below (and explained in detail on a Dedicated Page, produced to rebut the ProDrive claim that no such increase occurs):
- the smaller drive sprocket diameter (line 1) causes a 13% greater drive tensile load for the same applied torque (line 3);
- the larger moment arm of the belt drive sprocket (line 2) produces an additional 13% greater bending stress for the same applied bending load;
- the required belt preload combines with the bigger drive load {described in (a) above}, to produce significantly greater total side loads on the shaft end (line 4), which when applied to the larger moment arm {described in (b) above}, result in much bigger bending moment values (line 5) for the same operating condition.
An interesting by-product of the bigger loads imposed by the belt drive is the fact that the bearing loads (lines 11 and 12) are considerably greater (discussed later)
Preload is required in a V-belt system in order to provide enough friction to be sure the applied torque can be transmitted. The mathematics of the main V-belt drive show that the static preload required to transmit 150 HP at 4250 RPM is 610.5 lbs. in each span (lines 7 and 8), or a total force of 1221 lbs. Because the accessory drive belt loads are at approximately opposite right-angles to the engine drive belts and similar magnitudes, they are omitted from this analysis. Therefore the engine V-belt load is evenly split between the two clutch bearings.
Using the same calculation procedure, the preload for the tail rotor drive at 15 HP, 2168 RPM, the drive torque is 436 lb-in (line 10) and the required preload is 239 lbs. (line 6). In order to simplify the calculations, the tailrotor power consumption was kept at a constant 15 HP for all cases.
Preload is required in a tooth-belt system to prevent the belt teeth from skipping, or ratcheting when the torque is applied. If the preload of a toothbelt is slightly less than required, the teeth will try to climb the sides of the grooves at high torque loadings, which leads to (a) rapid wear of the belt, and (b) extremely high shaft bending loads (much higher than if the preload were correct).
ProDrive states that the actual preload in the toothbelt system is not as great as I have calculated IF their tensioning instructions are followed. We would answer that by stating that IF a toothbelt system is able to transmit the torque applied to it without jumping teeth or damaging the belt, it can reasonably be argued that the preload meets at least the minimum calculated requirement. (The engineers at Gates seem to have quite an accomplished understanding of how their product actually works.)
The mathematics of the toothbelt main rotor drive show that the minimum static preload required to transmit 123 HP at 2168 RPM is 1353 lbs. in each span, for a total force of 2707 lbs. (line 4). The reason the value changes slightly in the belt-cruise column is that the reduced drive torque in cruise causes the vector resolution of the forces in the "tight" and "loose" belt strands to change direction slightly.
Main rotor torque (line 9) is simply the torque at 2168 RPM for 123 and 95 HP respectively (max and cruise).
The shaft deflections shown in lines 15 and 16 are calculated deflections at the very top end of the shaft, and at the edge of the shaft-bearing interface.
(You might notice that these stress and deflection numbers quite a bit higher that those I published in the May-2004 issue of Rotorheads. The reason for the difference is that, after writing the article in late February, I discovered an error in the boundary conditions defining the FEA analysis. It had a small effect on the stresses but a larger effect on the deflections.)
Any bending load imposed on a rotating shaft will cause fully-reversing fatigue loads when the shaft rotates. That is the most severe form of fatigue loading. For a complete explanation, see Fatigue.
In the Metallurgy of the Secondary Shaft section, we showed that, under the ideal lab conditions in which fatigue life is measured, the infinite life fully-reversing cyclic stress level for the factory secondary shaft material is about 65,000 psi. After that has been reduced by the appropriate factors (ref-2:3:319-360) to account for the differences between the test conditions and the actual application, the allowable cyclic stress level for infinite life is about 38,200 psi.
The table (line 13) shows that the worst fatigue stress applied to the shaft (belt-drive) is about 25,100 psi, which is only about 65% of the endurance limit. So why are they failing? READ ON.