- Stress and Strain -
A quick review of the fundamentals
NOTE: All our Products, Designs, and Services are SUSTAINABLE, ORGANIC, GLUTEN-FREE, CONTAIN NO GMO's, and will not upset anyone's precious FEELINGS or delicate SENSIBILITIES.
In order to better understand the various discussions about loads, stresses and the expected life of components, it helps to have an understanding of the fundamental terms used in those discussions. The following paragraphs give a very brief background on those terms. Please note that this is a very basic explanation of subjects which some engineers spend their entire careers studying.
TENSILE and COMPRESSIVE STRESS
Stress is a value which describes the amount of load carried by each unit of cross sectional area of a component. For example, suppose the block shown in Figure 1 weighs 10,500 pounds and it is suspended from the shaft (with the arrowhead). The shaft diameter is 0.504", so it has a cross-sectional area of 0.200 square inches (in²).
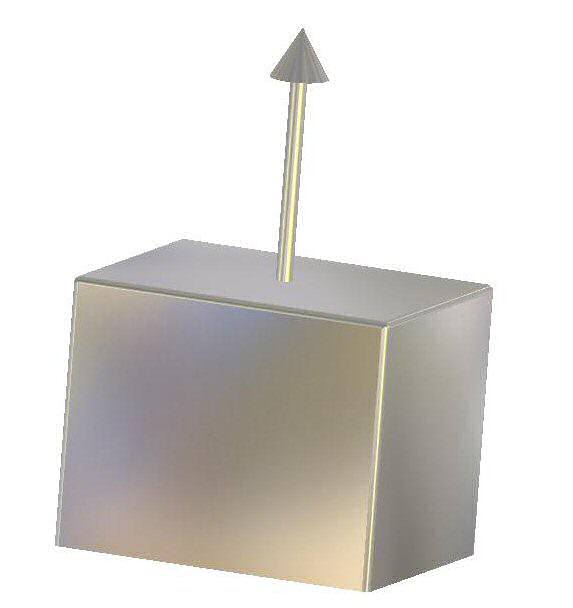
Figure 1
The stress that the 10,500 pound load applies to the shaft is defined as the load divided by the cross-sectional area of the shaft, which is 10,500 pounds ÷ 0.200 square inches = 52,500 pounds per square inch (psi). Note that this "load per unit area" is the PRESSURE concept, presented in Force, Pressure and Friction.
If the diameter of the shaft is increased to 3/4", then the area increases to 0.4418 square inches (in²) and the stress decreases to 10,500 ÷ 0.4418 = 23,766 psi.
Since the load shown in the picture is trying to lengthen the shaft, it is called tensile stress. If we flipped the picture over so that the shaft was supporting the block from underneath, the block would be trying to shorten the shaft, and the stress would be called compressive stress.
The loads which produce tensile and compressive stresses are acting perpendicular to the areas on which they act. Tensile and compressive stresses are often referred to
as normal stresses. Here, "normal" is not a behavioral term, but a geometric one, which, in this context means "acting perpendicular to"
a particular area or plane.
SHEAR STRESS
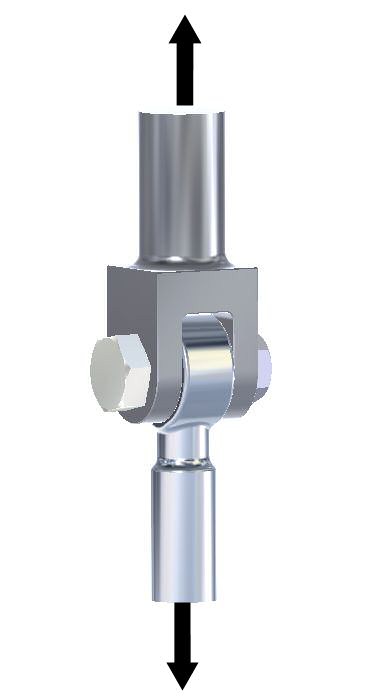
Figure 2
Forces which act parallel to the areas resisting them are known as shear forces, and produce shear stress in the elements which carry those loads.
For example, suppose the two clevises (clevi?) in this picture have equal tensile forces acting on their ends ("normal" to the end faces), as depicted by the arrows. Those forces are trying to pull the clevises apart, and in so doing, they apply a shear force (parallel to the cross-sectional area of the bolt) on the bolt holding the parts together. The shear force is trying to cut the bolt in half across its diameter in two places, where the two outer faces of the lower clevis meet the two inner faces of the upper clevis. This instance is known as "double shear" because there are two separate areas of the bolt exposed to the shear force.
Suppose the bolt in this example is 3/4" diameter, and the tensile loads are both 20,000 pounds. The cross-sectional area of the bolt is 0.4418 square inches (in²). Then shear stress applied to the bolt would be 20,000 pounds divided by twice the bolt area (because the load is shared by two different cross-sectional areas of the bolt), or 22,634 psi.
It is important to note that the shear stress capacity of most metallic materials is considerably less than the tensile or compressive capacities.
BENDING STRESS
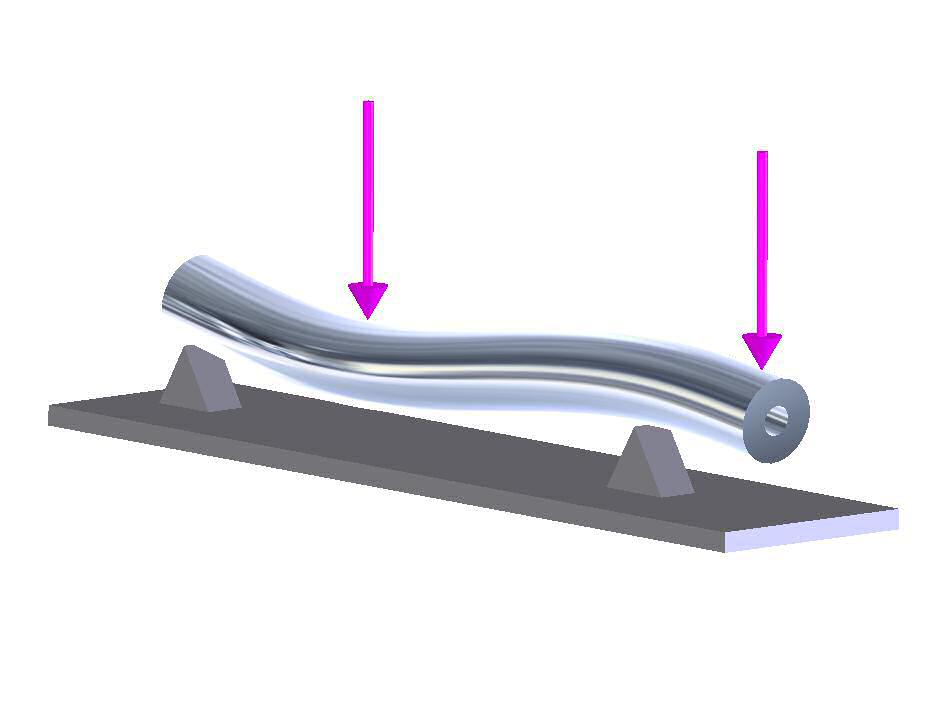
Figure 3
Bending Stress occurs when a component is loaded by forces which, instead of trying to stretch or shrink the component, are trying to bend it. Those bending forces generate a combination of tensile and compressive stress in the load-carrying components, known as bending stress.
An example of that type of loading is shown in tFigure 3, where the tubular shaft is resting on two triangular supports. The two vertical arrows represent downward forces applied to the tube. The tube deflects, or bends, downward under the influence of those forces, as illustrated.
If you cut a section through the tube at the right hand support and were able to visualize the internal stresses between metal molecules at the cut face, they would appear as tensile and compressive stresses, illustrated by the green arrows in Figure 4. The stress magnitude is largest at the outer extremities and decrease to zero at the geometric center.
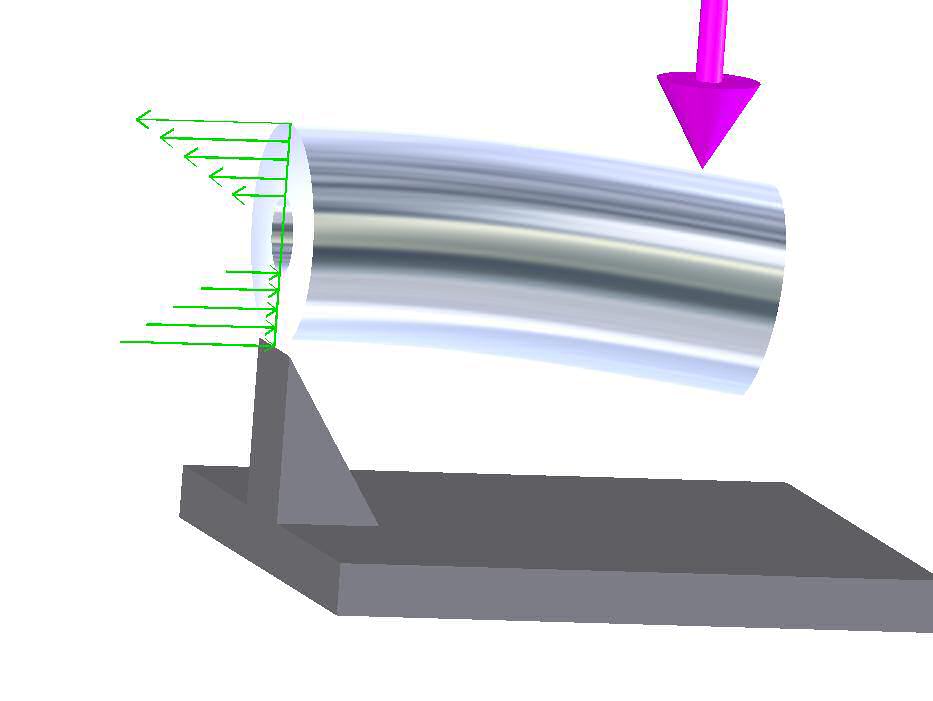
Figure 4
The bending stress is calculated from the properties of the cross-section and the magnitude of the bending moment. The bending moment is the magnitude of the applied force times the distance from the point where the force is applied to the cross section being examined. That horizontal distance from the point of application of the force (the purple arrow) to the cross-section is called the moment arm. (This is a massive simplification, but it illustrates the concept.)
STRAIN
Strain is the measure of how much a material deforms when a load is applied to it, expressed in inches of deformation per inch of material length. For example, if the 1/2" diameter shaft supporting the 10,000 pound load in Figure 1 is 12" long, it will stretch about 0.020" (20 thousandths) from its unloaded length, which you can measure. The strain is the measured deflection (0.020) divided by the length of the shaft, or 0.020 ÷ 12 = 0.00167 inches per inch.
Suppose you measure a specimen which has no load applied to it. Then you apply a load to the specimen, then release the load and measure the specimen again. If you find that it has returned to its original length, then the specimen experienced elastic deformation when it stretched under the load.
Most materials are elastic. That is, if you apply a load to the material, it will deform in some way, by an amount which is proportional to the load. When you remove the load, the material will return to its original shape, as long as the load wasn't too large. The deformation might be too small to measure, but it still occurs.
If, after the load is released, you can measure some permanent deformation in the specimen, (the specimen does not return to its original length), then the material has been stressed beyond its elastic limit and has experienced plastic deformation.
YIELD STRESS and ULTIMATE STRESS
There are two basic values which characterize the strength of a metal. Each of those values is a stress level at which a particular event occurs.
Figure 5
The dark line in Figure 5 shows the stretch of a specimen in response to an applied tensile stress. In this example, from 0 to to 70,000 psi the stretch (strain) is proportional to the stress, and if the load is removed, the specimen returns to its original length. This is known as elastic deformation.
However, if the load (in this example) exceeds 70,000 psi, notice that the strain becomes greater per unit increase in stress, and is no longer proportional to the stress. Once this specimen has been loaded beyond 70,000 psi, the specimen does not return to its original length (red line) when the load is removed. The specimen has been permanently deformed (plastic deformation).
The stress level at which a material no longer behaves elastically, but instead experiences a small permanent (plastic) deformation is known as the Yield Stress (YS), (also known as the proportional limit). That is the stress level at which the elastic limit of the material has been exceeded.
The second interesting value is called the Ultimate Tensile Stress (UTS). It is the stress value at which the material will break under the influence of pure tensile stress.
A specialized test machine is used to measure those values. A small sample of the subject metal (usually 0.357" or 0.504" diameter) is installed in the machine, as shown in Figures 6 and 7 below.
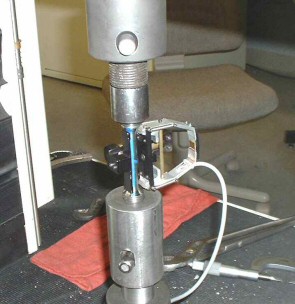
Figure 6 |
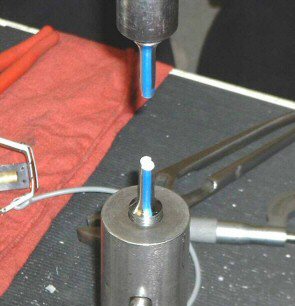
Figure 7 |
The machine applies a tension load on the specimen, and increases the load until the specimen breaks. The computer which controls the machine plots the load vs. deflection in real time, and detects the yield point. At some point after the material begins to yield, the operator pauses the test and removes the deflection gauge (to prevent it from being destroyed when the specimen fractures). The operator then resumes the test and the machine continues to increase the load until the specimen breaks. The load at which the specimen broke is divided by the original cross-sectional area (0.100 in² for 0.357" diameter or 0.200 in² for 0.504" diameter) to find the UTS value. As the specimen approaches the failure point, a portion of the diameter (where the failure will occur) begins to plastically-deform and reduce in diameter ("necking-down"). The percentage that the cross sectional area of the material reduces is a measurement of the ductility (lack of brittleness) of the material, and is stated as %-reduction-in-area (ROA).
STRESS CONCENTRATION
It has been known for a long time that the presence of irregularities or discontinuities in a part (holes, rapid changes in diameter, shoulders, grooves, notches, etc.) significantly increases the value of the actual stress which occurs in a part when compared to the stress value calculated based on the cross section of the part. These increases in stress, called stress concentrations, occur in the immediate vicinity of the discontinuity.
The ratio of the actual stress to the calculated stress is known as a stress concentration factor. The magnitude of stress concentration factors can be 3, 4, or more depending on the severity of the particular discontinuity.
This phenomenon can be demonstrated in tests. There is a large body of accumulated data relating the physical characteristics of various types of discontinuities to the increase in observed stress they cause. There are several books which present the methods to calculate these factors. One of the most accepted works on this subject is Peterson's Stress Concentration Factors (ref-2:4). Some FEA systems have incorporated the effect of discontinuities into their calculations.
There are also several accepted methods to diminish the stress-increasing effect of discontinuities, including tapers, large fillet radii, radiused undercuts, and gentle discontinuities surrounding a necessarily abrupt one.
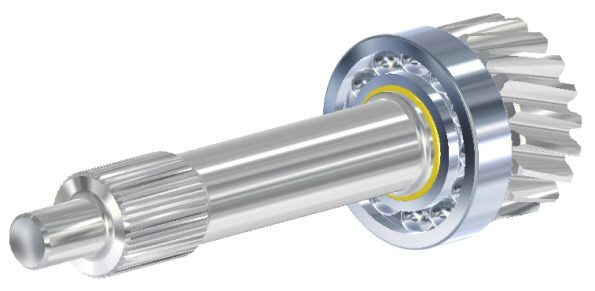
As an example of theses techniques, consider the picture below, showing a typical input shaft for an automotive transmission, with a shoulder for the supporting bearing and a snap-ring retaining the bearing on the shoulder.
The following two pictures show a cross section through the shaft pictured above, without the bearing or snap ring installed. Figure 8 shows the typical shaft implementation, with a sharp-cornered snap ring groove (necessary to clear the edges of the snap ring), and a sharp-cornered shoulder, required to clear the small radius on the edge of the bearing, typically less than 0.040". The sharp corners in the groove and the shoulder provide severe concentrations (as much as 10 to 1) for the applied stresses, making the material behave in fatigue (next topic) as if the applied stress was significantly greater. Compare theshaft in Figure 8 to the better configuration shown in Figure 9, which has teardrop, large-radius grooves on both sides of the sharp-cornered snap ring groove, and which has a large radius undercut into the bearing shoulder. These provisions dramatically reduce the stress concentrations (down to as low as 1.5 to 1) as compared to Figure 8.
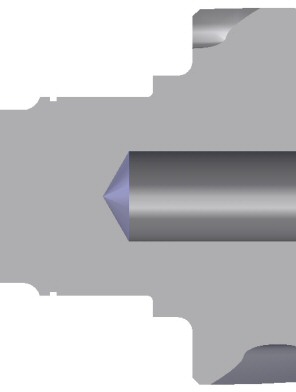 Figure 8 |
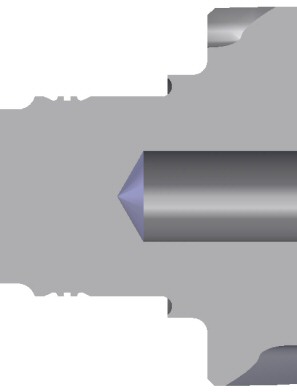 Figure 9 |